Quick Charts provide and instant graphical view of selected data in IFS Applications table/overview pages. The chart may be printed, saved to file or copied to the clipboard for easy sharing. The Quick Chart option is available via the Context Menu Quick Chart. A Quick Chart has an X-axis and an Y-axis which are defined by the user. There is no automatic grouping of values. If you want summarized values use Group & Sum in the search dialog to group the information before viewing the chart.
A Quick Charts is connected to the page where it's defined. It’s possible to save the definition of a quick chart so it can be reused later. The Quick Charts are personal and stored in the user profile which means they may also be distributed via the base profile by a System Administrator.
Figure 1: Quick Chart example
You must have the permission to view Quick Charts to be able to see the option in the Context Menu.
You must have the permission to configure Quick Charts to be able to configure.
The Quick Charts are stored in your user profile.
N/A
N/A
Populate a table window with information and select Quick Chart via the right-mouse button Context Menu. If you don't see this option the page does not display any numerical columns or you don't have the permission to use Quick Charts.
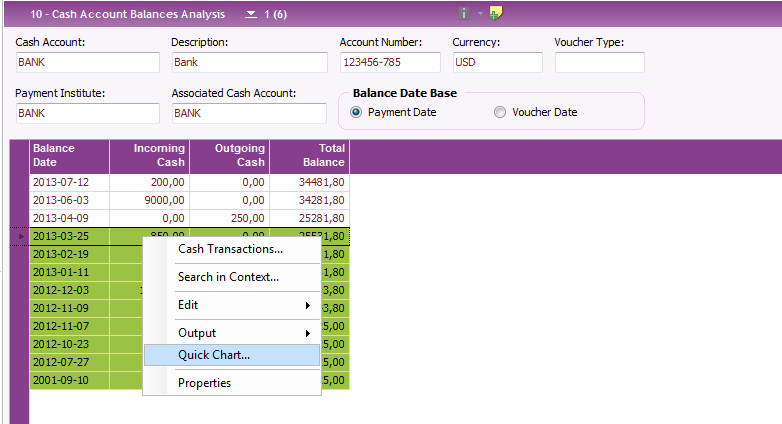
Figure 2: Context Menu Quick Chart
You will get a question which rows you want to base the chart on, selected rows or all populated rows.
There are now two scenarios:
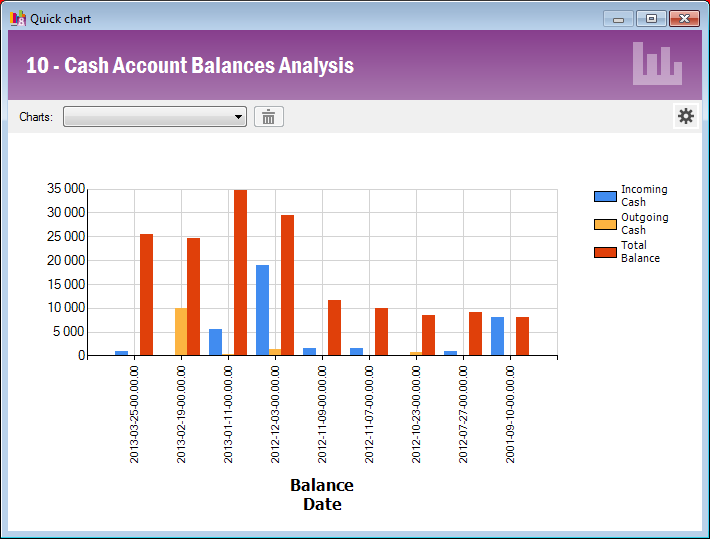
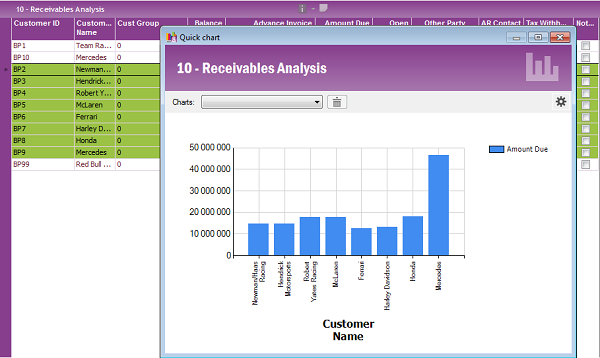
Figure 3. View Quick Chart Example
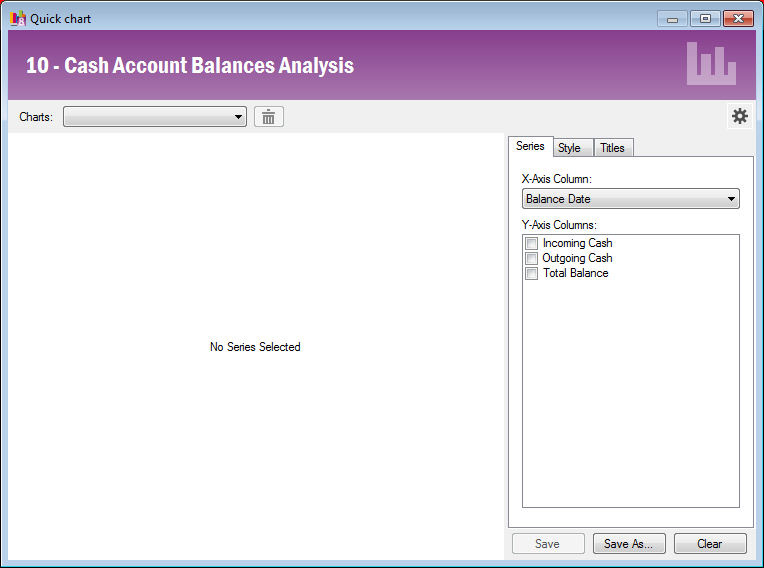
Figure 4: View Quick Chart Example, Quick Charts have not been used for the page before
Double click on the chart area to zoom. The area you mark will be highlighted with a yellow frame, use the mouse wheel to zoom into the highlighted area. Via right mouse button you have the option to reset the zoom again.
The following options are also available via the context menu, right mouse click on the chart area to open the context menu.
You change Quick Chart definitions in the Chart Definition panel. Open it by clicking on the Cogwheel button in the right hand corner of the dialog.
The chart definition panel has three tabs, Series, Style and Titles.
In order to view the chart you must define X-axis and Y-axis in the Series tab. In the drop-down list by the X-axis you can choose from all columns in the table window, the first column is suggested. Then you define which values you want in the Y-axis, all numerical columns in the table window are possible to choose from. Check the check boxes for the columns you want to use. Once you mark a check box the chart will be drawn, in this example all columns are selected, see below.
Note that the chart will show each selected row from the table window, the information is not grouped or summarized. If you want to summarize data you can use the Group & Sum function in the Search dialog, see section Advanced example Quick Chart using Group and Sum
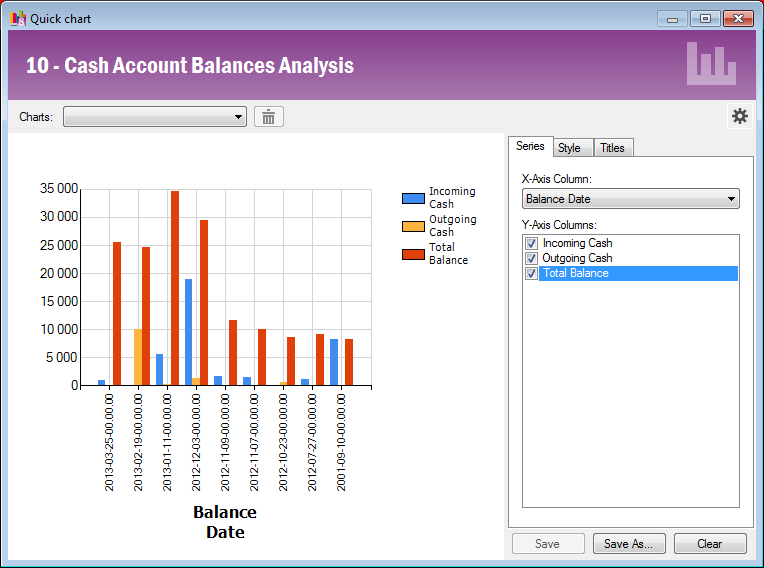
Figure 5: Quick Chart Series tab
In the Style tab you have the option to change palette, type of chart
etc. There are a number of predefined chart types to choose from, bars, columns,
stacked columns, line, pie chart etc. Note that when you select Chart Type you
highlight the series you want to apply the type for.
E.g. if you want the same type for all series, highlight all series before
selecting Chart Type. I you want
one of the series to have a different type than the others, highlight that
series and select Chart Type. In the example below two types are combined. Incoming
Cash and Outgoing Cash are using Chart Type "Column" and the Total Balance series is using "Line".
It is also possible to change the legend text. In the example below the legend text "Total Balance" is changed to "Total" in the Custom Legend Text field.
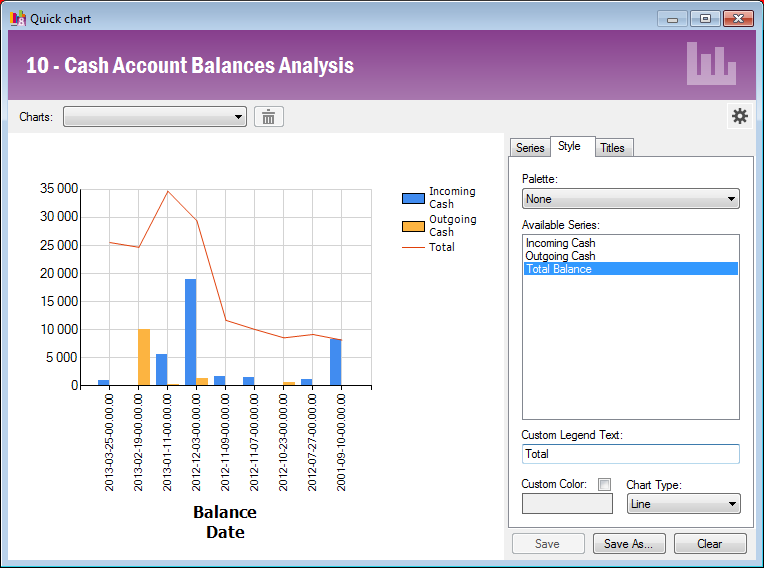
Figure 6: Quick Chart Style tab
In the Title tab you have the option to change the title for the chart and for the X- and Y-axis, see example below.
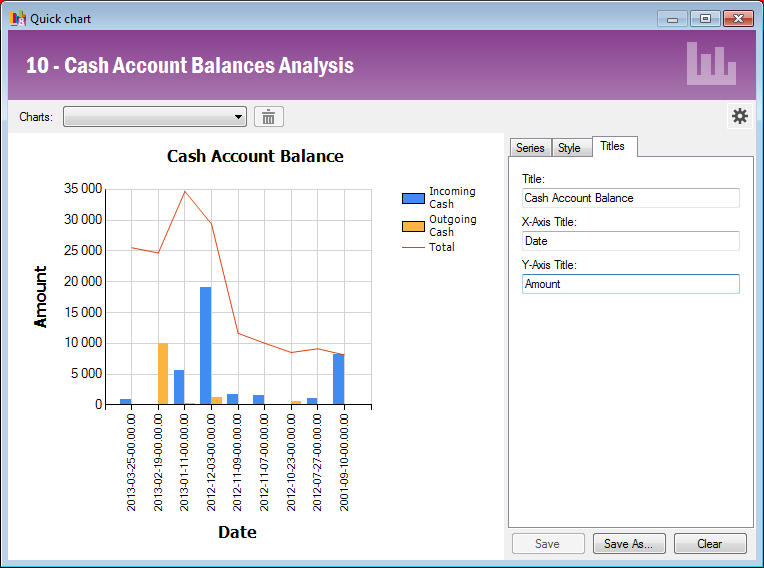
Figure 7. Quick Chart Titles tab
Save the chart definition if you want to reuse it later, the chart definition
will be stored in your user profile for the specific table window.
Click the Save as button and the dialog below will
be displayed. Enter the title of the chart and click OK to save.
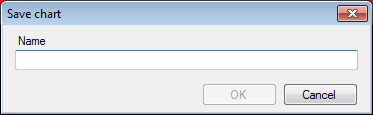
Figure 8. Save Quick Chart dialog.
If you are making changes in the definition of an already saved chart you click the Save button to save and the Save as button to save as a new chart definition.
Sometimes you might want to group and/or summarize the information in a Quick
Chart. Since the Quick Chart is displaying all the selected rows and columns in
the table window you have to group and/or summarize the information before you
view the Quick Chart.
This is done via Advanced Search in the Search dialog, see example below
Let's say you want to view a Quick Chart of planned purchase order values summarized per supplier.
1. Open the Purchase Orders page
2. Open the Search Dialog via F3 or the Search button and click the Advanced button.
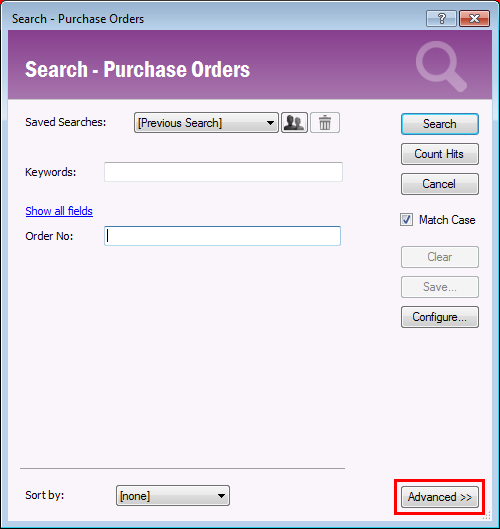
Figure 9: Search dialog
3. Specify which fields you want to group and which values you want to sum, see below, and click Search button.
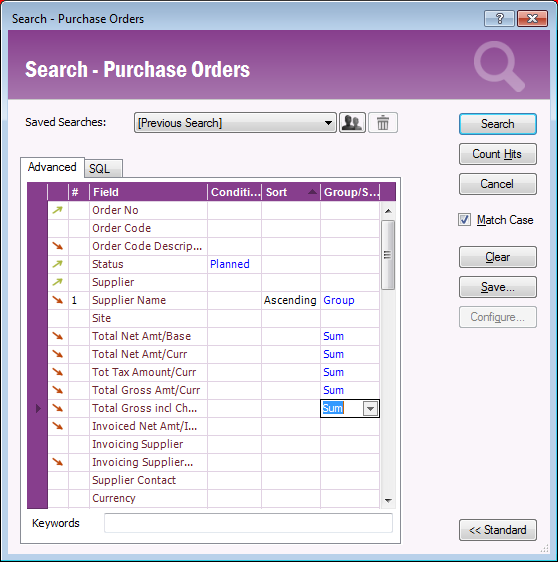
Figure 10. Example group and and sum in Advanced search
The search result will be presented as below.
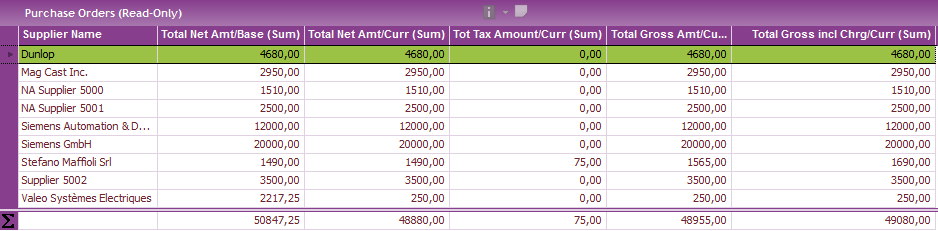
Fig 11. Search result after group and sum
4. View the quick chart as described in section View Quick Chart. In this example the Chart Type is "Pie" and the Palette is "Pastel".
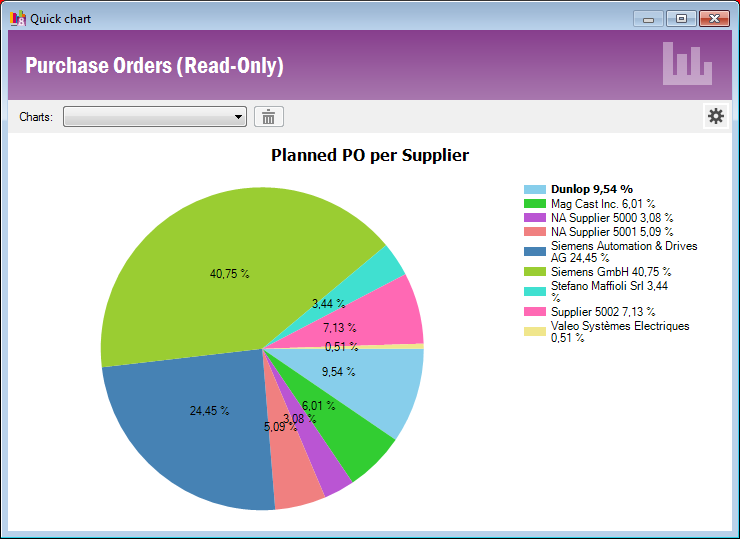
Figure 12. Example Quick Chart Type "Pie"